Load and Performance Testing with Apache JMeter and Postman Runner
Load and Performance Testing with Apache JMeter and Postman Runner
Load and performance testing is a crucial step in ensuring that your applications can handle real-world traffic without compromising on performance. In this blog post, we'll explore two powerful tools for conducting load and performance tests: Apache JMeter and Postman Runner. We'll guide you through the basics of using each tool, allowing you to simulate various user scenarios and measure your application's response under different loads.
Apache JMeter
What is Apache JMeter?
Apache JMeter is an open-source Java-based desktop application designed to load test and measure the performance of web applications. It offers a wide range of features for simulating different user behaviors and traffic loads.
Getting Started with Apache JMeter
- Download and Install: Begin by downloading Apache JMeter from the official website and installing it on your machine.
~/Downloads/apache-jmeter-5.6/
backups/ bin/ docs/ extras/ lib/ licenses/ printable_docs/ - Create a Test Plan: Launch JMeter and create a new test plan. The test plan acts as a container for various elements like thread groups, samplers, and listeners.
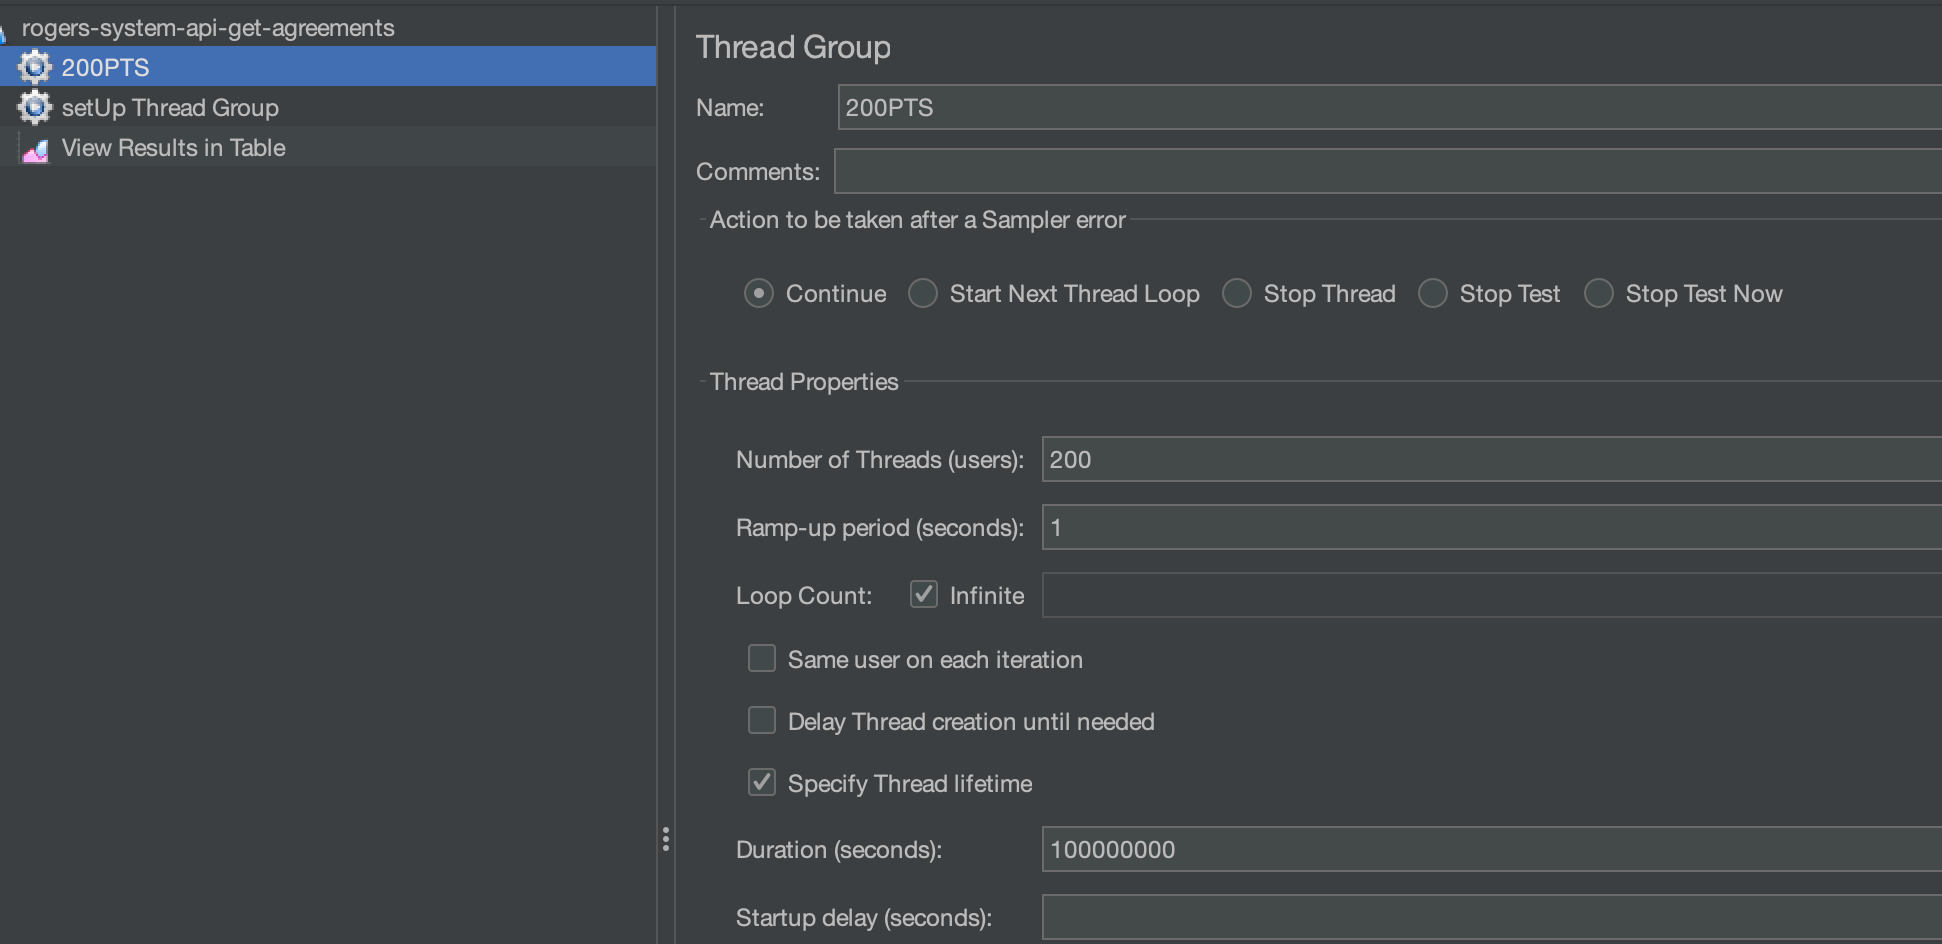
- Configure Thread Groups: Thread groups define the number of virtual users, ramp-up time, and loop count. Add a thread group to your test plan and configure it according to your test scenario.
- Add Samplers: Samplers simulate different types of user requests, such as HTTP requests. Configure HTTP samplers with the target URL, method, parameters, and headers.
- Configure Listeners: Listeners collect and display test results. Add listeners like "View Results Tree" or "Summary Report" to monitor the test execution and analyze results.
- Run the Test: Start the test plan and observe how JMeter simulates user interactions and measures your application's performance under load.
Using 'setUp Thread Group' for Common Test Setups
In Apache JMeter, the 'setUp Thread Group' serves as a powerful tool to streamline common test setups before the actual load performance test. One common scenario is when you require OAuth2 authentication for your test APIs. By utilizing the 'setUp Thread Group,' you can efficiently obtain the access token and set its value to properties, making it accessible throughout your load performance test.
OAuth2 Authentication Example
Let's consider a scenario where your API endpoints require OAuth2 authentication. Here's how you can leverage the 'setUp Thread Group' to seamlessly handle the authentication process:
- Configure 'setUp Thread Group': Begin by adding a 'setUp Thread Group' to your test plan. This group will execute once at the start of your test and handle common setups.
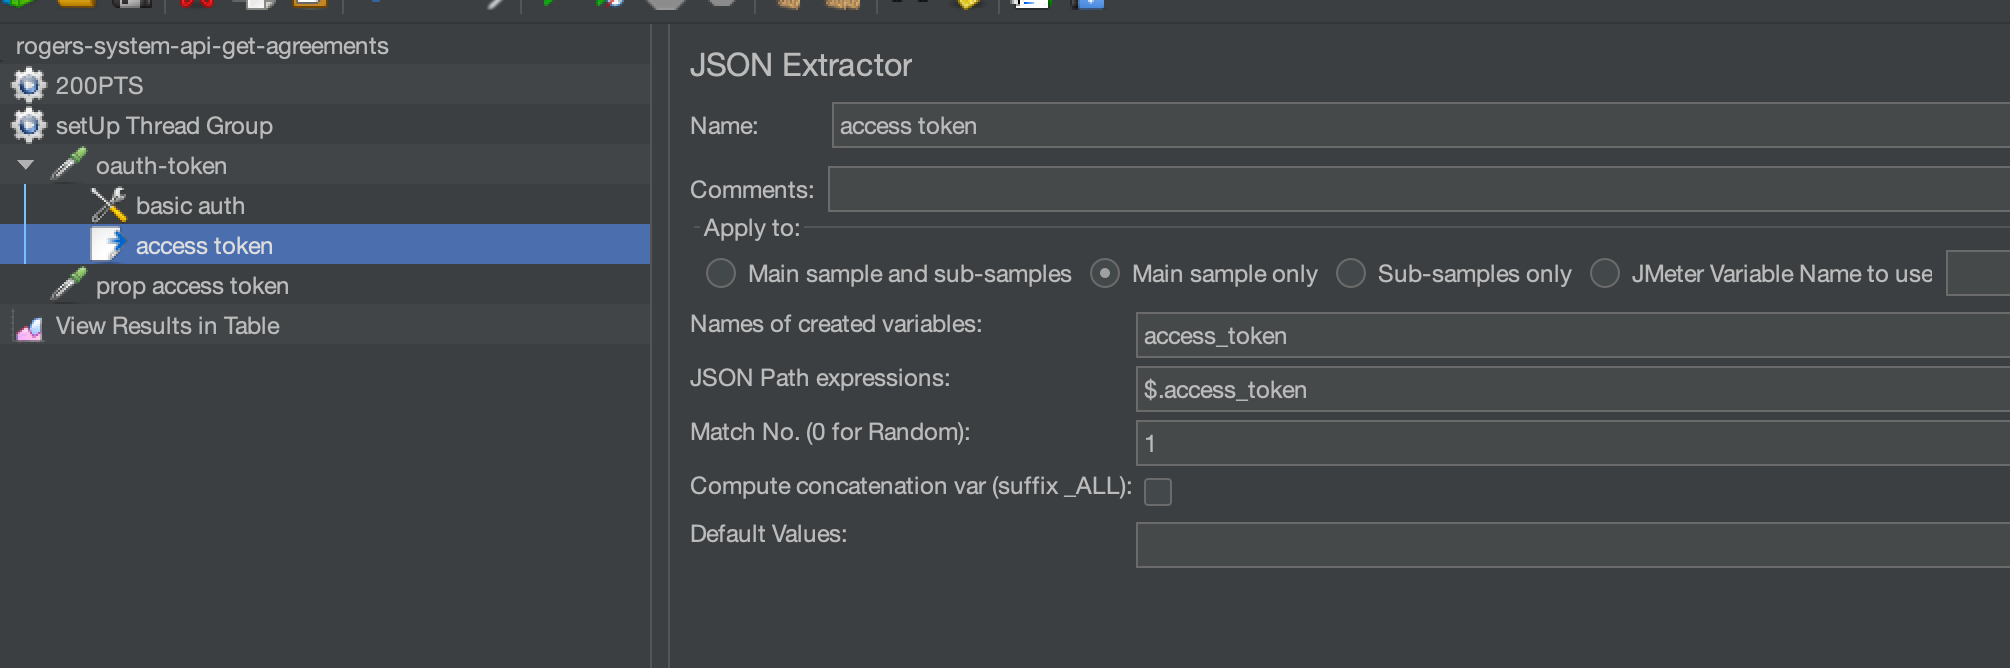
- OAuth2 Token Retrieval: Within the 'setUp Thread Group,' add an HTTP Sampler to retrieve the OAuth2 access token from your authorization server. Extract the token from the response and set its value to a JMeter property using a Regular Expression Extractor or a JSON Extractor.
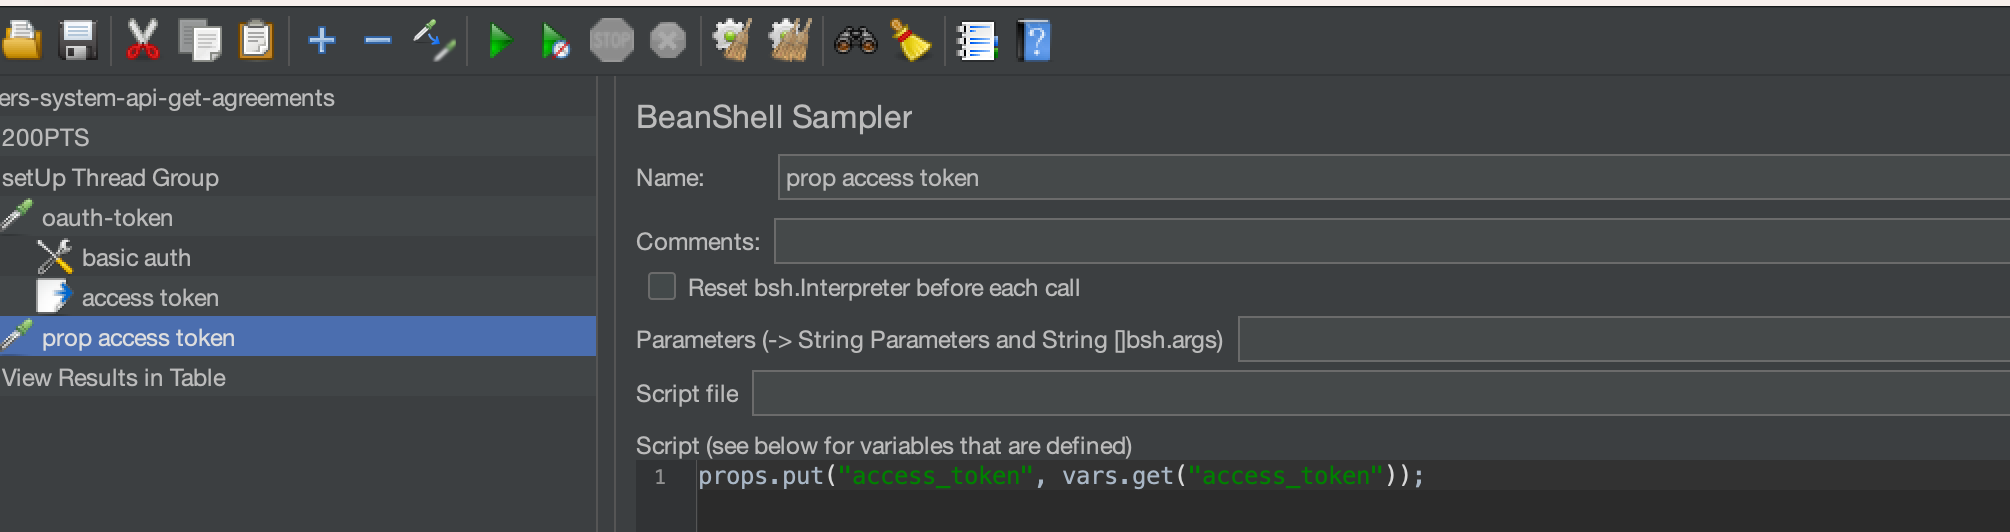
- Set Property: Use a 'Beanshell Sampler' or a 'JSR223 Sampler' to set the obtained access token as a JMeter property. This property will be accessible across different thread groups.
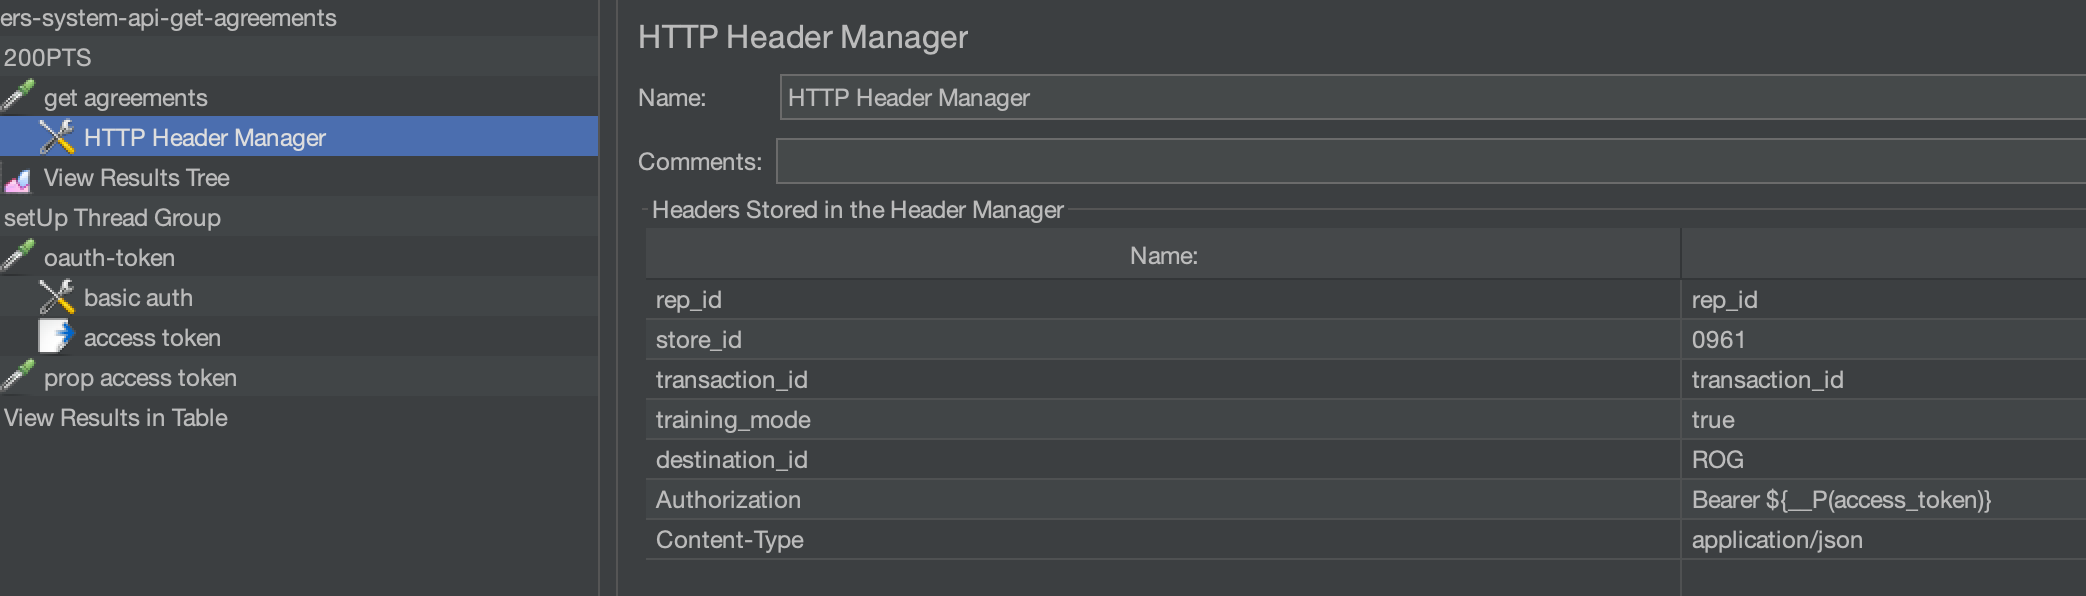
- Load Performance Test: In your main load performance test thread group, you can now easily reference the OAuth2 access token property in the Authorization header of your HTTP requests. This ensures that each virtual user uses the correct access token for authentication.
Benefits of 'setUp Thread Group'
By employing the 'setUp Thread Group,' you achieve several benefits:
- Efficiency: OAuth2 token retrieval and property setting are performed only once, reducing redundant operations during load testing.
- Consistency: All virtual users share the same access token, ensuring consistent and accurate authentication across the test.
- Flexibility: Properties set in the 'setUp Thread Group' can be accessed in subsequent thread groups, allowing you to centralize and manage common variables efficiently.
- Ease of Maintenance: Updates or changes to the access token handling need to be done in a single location (the 'setUp Thread Group'), simplifying maintenance.
In summary, the 'setUp Thread Group' in Apache JMeter empowers you to set up common test configurations, such as OAuth2 authentication, before executing the load performance test. This approach enhances efficiency, consistency, and flexibility in your testing process. By incorporating the 'setUp Thread Group' technique into your load performance testing strategy, you ensure a smoother and more organized testing experience.
Analyzing Load Test Results with "View Results Tree" and "View Results in Table"
After conducting your load and performance tests using Apache JMeter, it's essential to analyze the results to gain insights into your application's behavior under different loads. Apache JMeter provides powerful listeners like "View Results Tree" and "View Results in Table," which allow you to visualize and interpret the test outcomes effectively.
"View Results Tree" Listener
The "View Results Tree" listener is a versatile tool that provides detailed information about each sample executed during the test. It offers a comprehensive view of individual requests, along with response data, headers, and timing metrics. Here's how you can benefit from the "View Results Tree" listener:
- Response Data: You can examine the actual response data returned by the server. This is especially useful for debugging and identifying potential issues.
- Request and Response Headers: The listener displays the request and response headers, aiding in understanding communication between the client and server.
- Timing Metrics: "View Results Tree" provides various timing metrics, including response time, latency, and connect time. These metrics help identify performance bottlenecks.
"View Results in Table" Listener
The "View Results in Table" listener offers a tabular representation of test samples, making it easier to compare and analyze results. This listener provides a condensed overview with key metrics for each request. Here's how the "View Results in Table" listener can assist you:
- Concise Summary: The table format presents essential information such as sample number, label, response time, and status in an organized manner.
- Sorting and Filtering: You can sort the table based on specific columns or apply filters to focus on particular aspects of the test.
- Exporting Data: The table view can be exported to various formats (e.g., CSV, XML), enabling further analysis using external tools.
Utilizing the Listeners
To make the most of these listeners:
- Adding Listeners: While configuring your test plan, add the desired listeners by right-clicking on thread groups, samplers, or controllers and selecting "Add" > "Listener."
- Configuring Display Options: Both listeners offer options to customize the displayed data, such as choosing response data formats or columns in the table view.
- Interpreting Results: Monitor response times, error rates, and other metrics to identify performance bottlenecks and areas for improvement.
- Analyzing Patterns: Look for patterns in the test results, such as gradual degradation under increasing loads or unexpected spikes in response times.
The "View Results Tree" and "View Results in Table" listeners in Apache JMeter are indispensable tools for analyzing load test results. By utilizing these listeners effectively, you can gain valuable insights into your application's performance, diagnose issues, and optimize its responsiveness under various loads. Remember that a thorough analysis of test results is essential for making informed decisions and fine-tuning your application for optimal performance.
Postman Runner
What is Postman Runner?
Postman Runner is a feature within the Postman API testing tool that allows you to create and execute collections of requests in a sequence. It's an excellent choice for testing APIs and endpoints with varying data and conditions.
Getting Started with Postman Runner
- Download and Install Postman: If you don't have Postman installed, download and install it from the official website.
- Create a Collection: Launch Postman and create a new collection to organize your test requests.
- Add Requests to Collection: Within the collection, add individual requests that you want to test. Configure request parameters, headers, and authentication.
- Define Test Scenarios: Use folders or tags within the collection to define different test scenarios. Each scenario can include a sequence of requests.
- Configure Collection Runner: Open the collection runner and select the collection and test scenarios you want to execute. You can also set the number of iterations and concurrent users.
- Run the Test: Start the collection run, and Postman Runner will execute the requests in the defined sequence and generate detailed reports.
Choosing the Right Tool
Both Apache JMeter and Postman Runner offer powerful capabilities for load and performance testing, but the choice depends on your specific requirements and preferences.
- Use Apache JMeter if you need to simulate complex user scenarios, handle a large number of concurrent users, and perform in-depth analysis of your application's performance metrics.
- Use Postman Runner if your focus is on testing APIs and endpoints with varying data and conditions, and you prefer an intuitive user interface.
Conclusion
Load and performance testing are vital to ensure your applications can handle user traffic effectively. Apache JMeter and Postman Runner are valuable tools that can help you simulate real-world scenarios, measure response times, and identify bottlenecks. By following the steps outlined in this blog post, you'll be well-equipped to use either tool for your load and performance testing needs.
In our next post, we'll dive deeper into advanced techniques and best practices for load testing with Apache JMeter and Postman Runner. Stay tuned!