Load Performance Testing: Monitoring and Analysis

In the realm of load performance testing, understanding how your application behaves under different loads is paramount. In this blog post, we'll take a hands-on approach by running a JMeter test plan, monitoring memory usage using top -pid, utilizing IntelliJ IDEA's profiler tool for live monitoring, and diving into JMeter's "View Results in Table" report to gain insights into API performance.
Running a JMeter Test Plan
- Setting Up JMeter: Ensure you have Apache JMeter installed. Create a test plan that simulates your desired load scenario, incorporating thread groups, samplers, and listeners.
- Running the Test: Execute the test plan. Observe how JMeter simulates user interactions and gathers data.
Monitoring Memory Usage with top -pid
The top command provides valuable insights into system resource usage. To monitor memory usage for a specific process, use top -pid <PID>. Here's a breakdown of the output:

- PID: Process ID of the monitored application.
- USER: User account running the process.
- PR: Priority of the process.
- NI: Nice value of the process.
- VIRT: Virtual memory usage (including shared libraries and swapped-out pages).
- RES: Resident memory usage (actual physical RAM).
- SHR: Shared memory size.
- S: Process status (e.g., R for running).
- %CPU: Percentage of CPU usage.
- %MEM: Percentage of memory usage.
- TIME+: Total CPU time used.
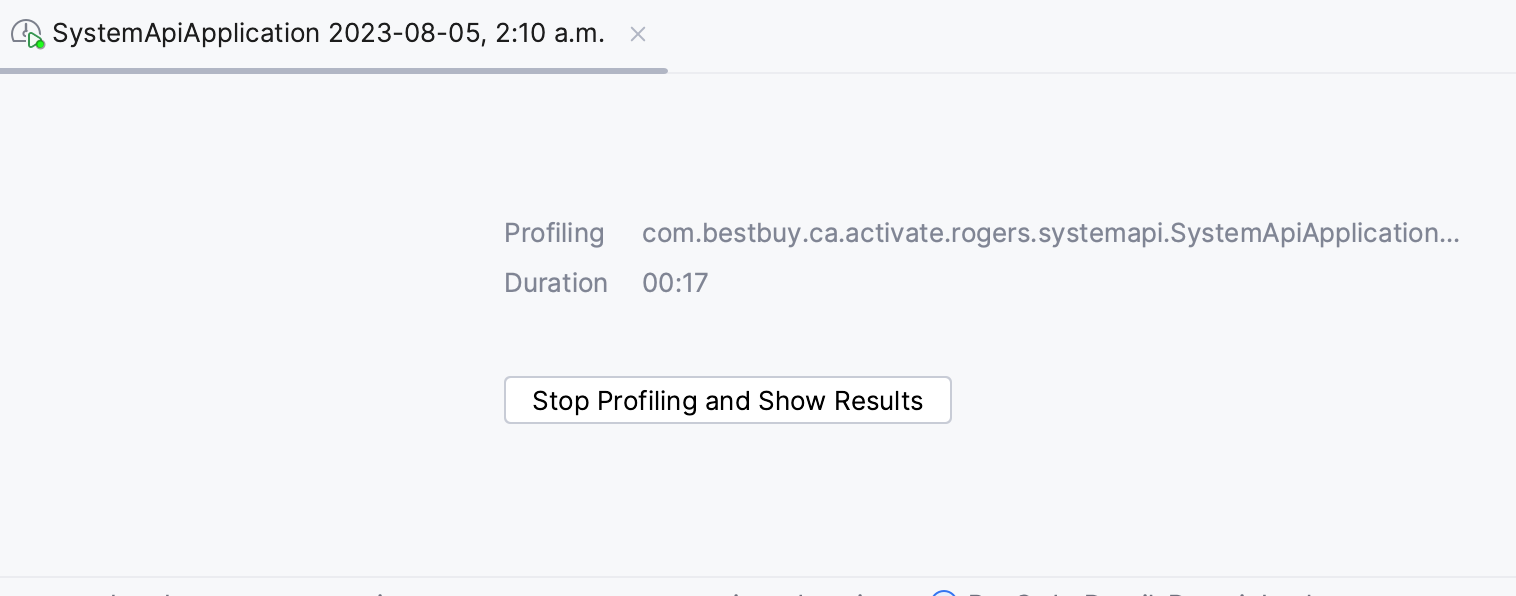
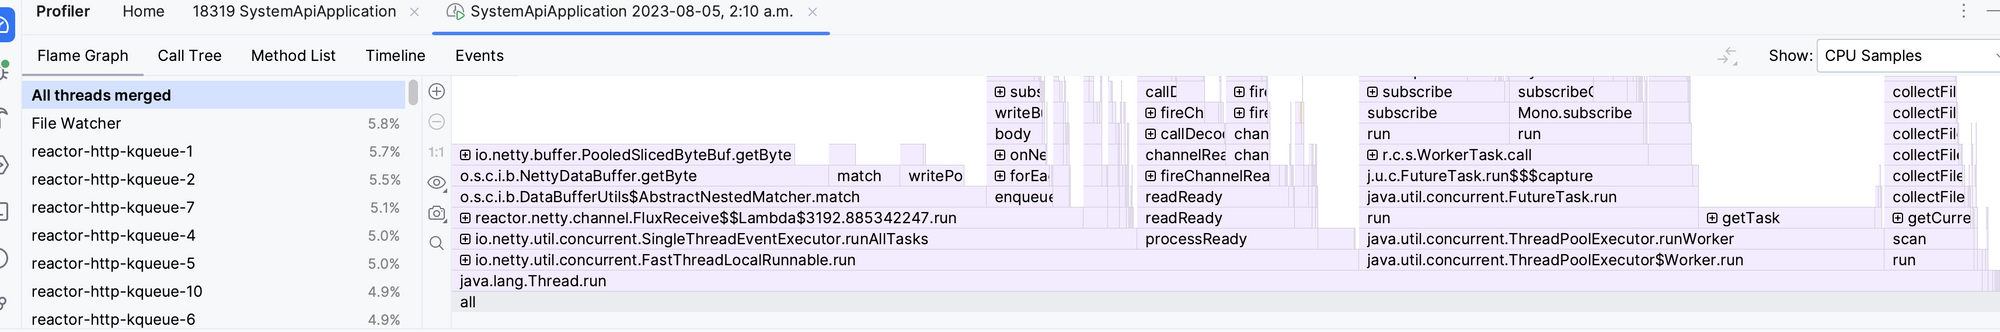
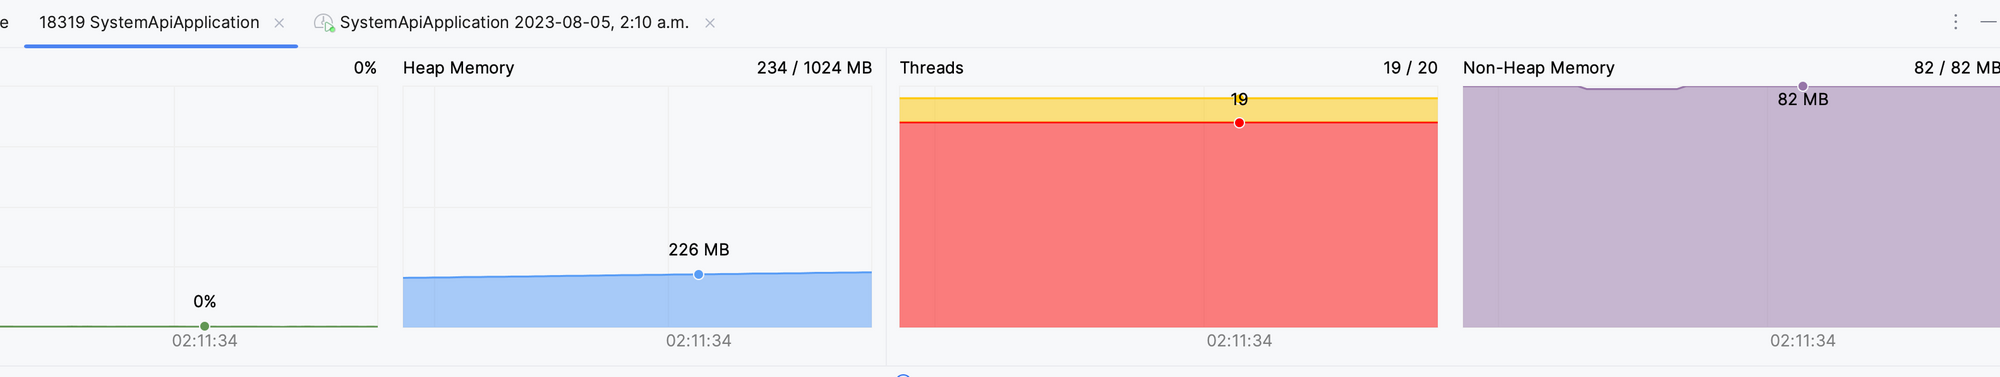
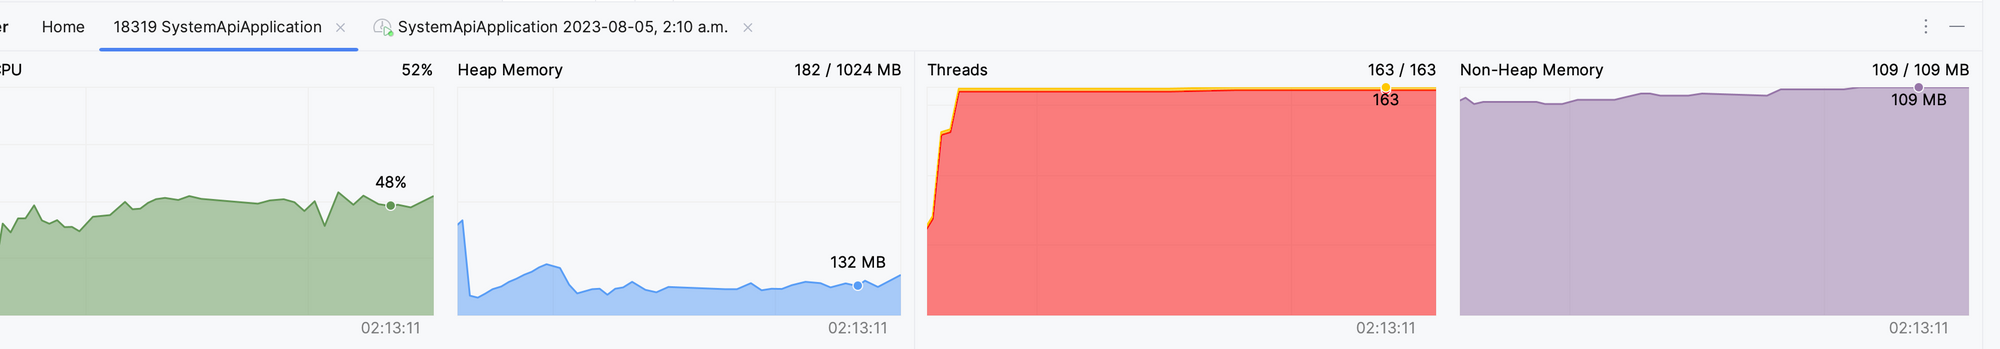
Using IntelliJ IDEA Profiler Tool
IntelliJ IDEA offers a powerful profiler tool for in-depth performance analysis. Here's how to utilize it:
- Profile Application: Launch your application in IntelliJ IDEA and start profiling. Observe real-time CPU and memory usage charts.
- Inspect Live Data: Examine CPU and memory charts to identify spikes, trends, and anomalies during load testing.
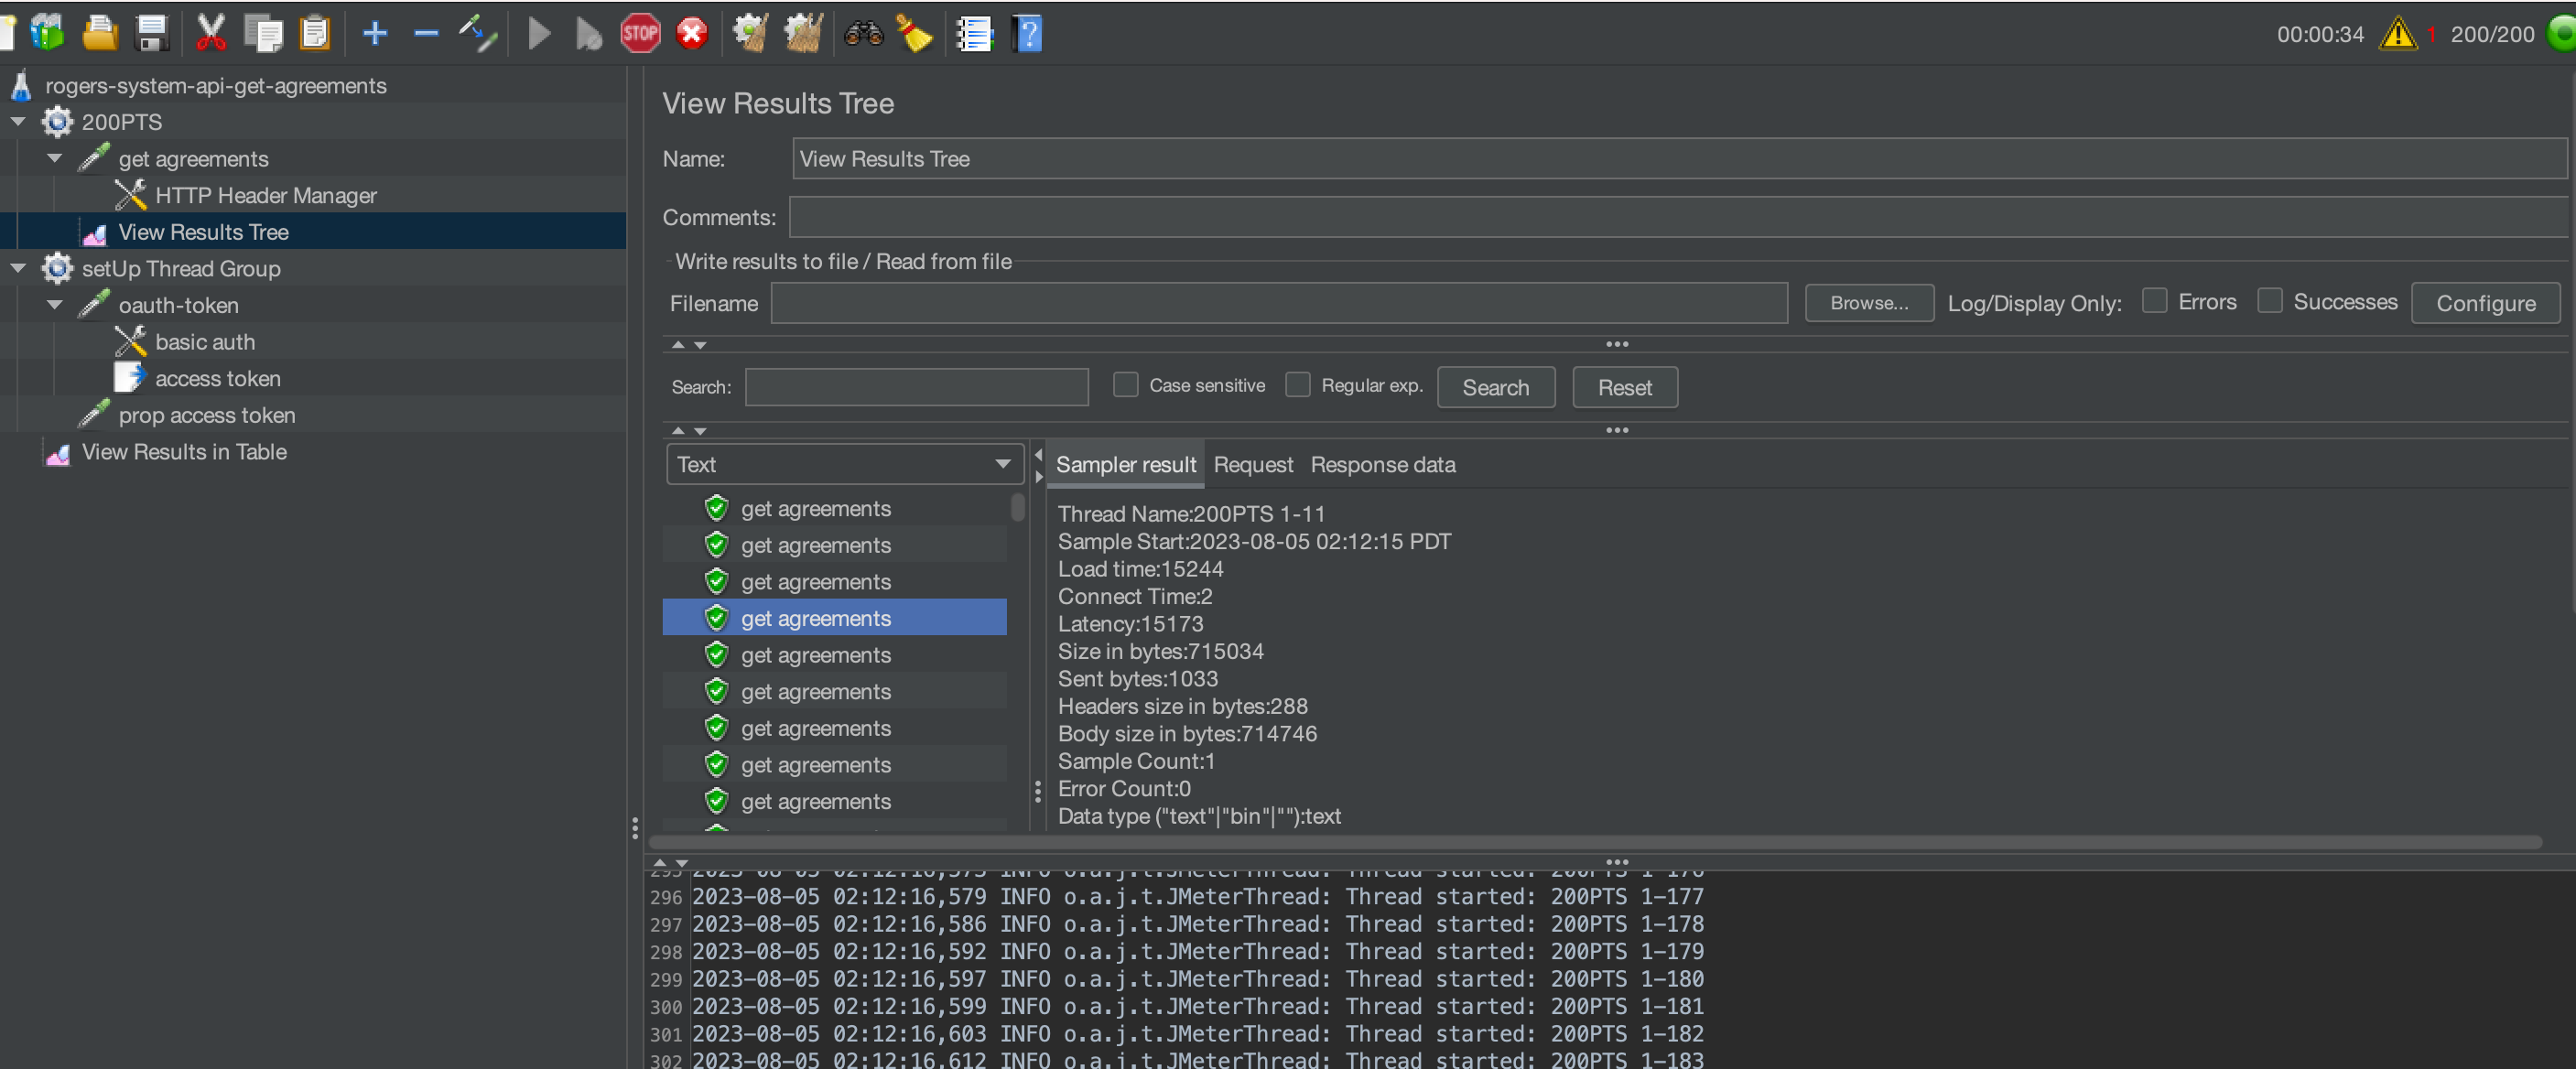
Analyzing "View Results in Table" Report
JMeter's "View Results in Table" listener provides crucial performance insights. Here's what to look for:
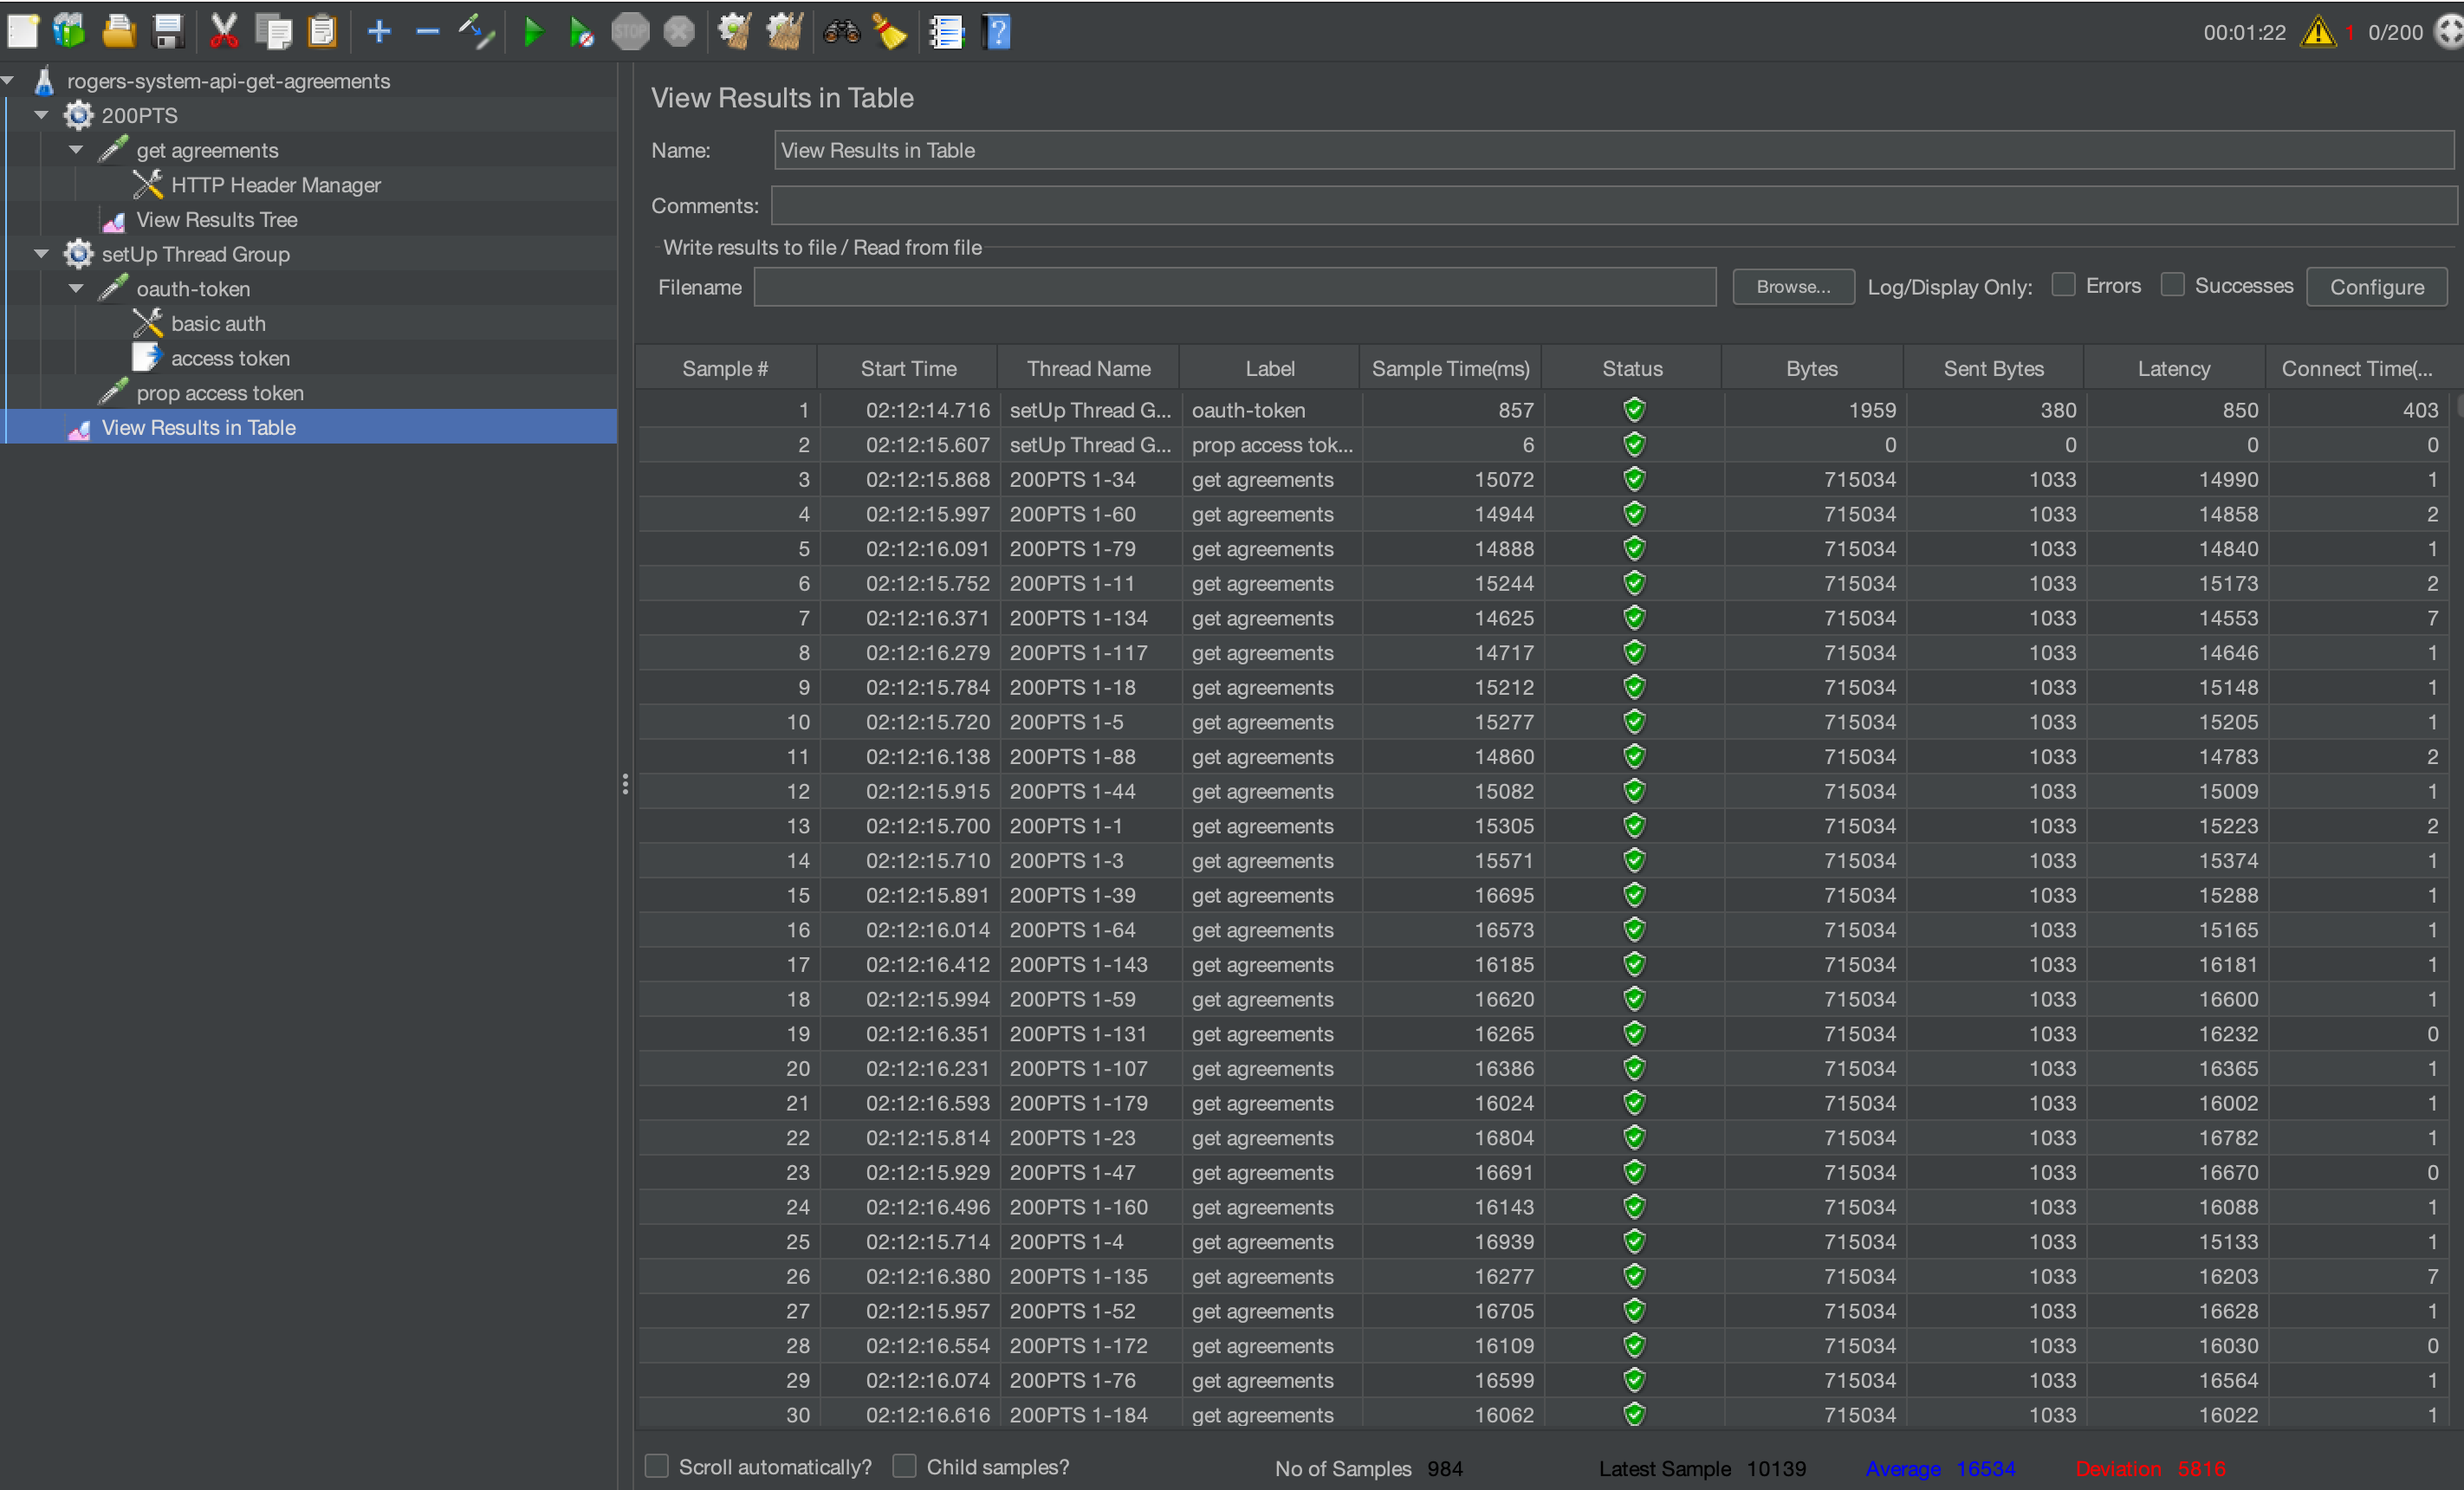
- Label: Request name or label.
- Sample Count: Number of samples executed.
- Error Count: Number of failed samples.
- Average: Average response time.
- Median: Median (50th percentile) response time.
- 90% Line: Response time below which 90% of samples fall.
- 95% Line: Response time below which 95% of samples fall.
- 99% Line: Response time below which 99% of samples fall.
- Min: Minimum response time.
- Max: Maximum response time.
Conclusion
Load performance testing goes beyond executing test plans. Monitoring memory usage with top -pid, leveraging IntelliJ IDEA's profiler tool, and analyzing JMeter's "View Results in Table" report offer comprehensive insights into your application's behavior. By combining these techniques, you can identify performance bottlenecks, optimize resource utilization, and fine-tune your application to deliver exceptional user experiences under various loads.
In our upcoming posts, we'll explore advanced load testing strategies, including parameterization, correlation, and scripting. Stay tuned for more in-depth insights into mastering load performance testing!